- User Interviews
- | Usability Testing
- | Design Workshop
- | Site Usability Survey
- | Sketch
- | Invision
TOOLS
Client Brief
The City of Boston’s Department of Innovative Technology Team asked us (team of 3) to evaluate & improve the use of tables on boston.gov. They specifically asked for guidance on overall styling, when tables should be used, when tables should not be used, & how best to display information to Boston Residents, as well as visitors.
The client viewed this project as a continuation of their overall rebranding & redesign of boston.gov they had started a few years ago. While this site is already one of the best government websites in the country, the client is always looking to improve the display of information & most importantly the communication between the City & their Residents.
My Role
Research
Led research approach & execution.
Led research spike on data visualization, focused on tabular data.
Led creation of Usability Testing Protocol including: Interview, Contextual inquiry, Participatory Design, & Site Usability Survey.
Design
I led the team in organizing daily deliverables through an Agile framework & conducted a daily Slack Standup with stakeholders.
Led research, creation, & testing of “Style Guide for Tables.""
Designed & iterated on all deliverables.
Team Lead
Point of Contact for CoB DoIT Stakeholders.
Led team in a “scrum master like” fashion using Agile Methodologies.
Led in delivery of presentation to stakeholders.
Solutions
Our research led us to create 3 deliverables that met the user's goals, met the client's goals, as well as took into account varying degrees of time/effort for a developer to implement. The client really appreciated this approach because we understood & exceeded their immediate goals, but also elightened them to what users really are looking for from location-based datasets.
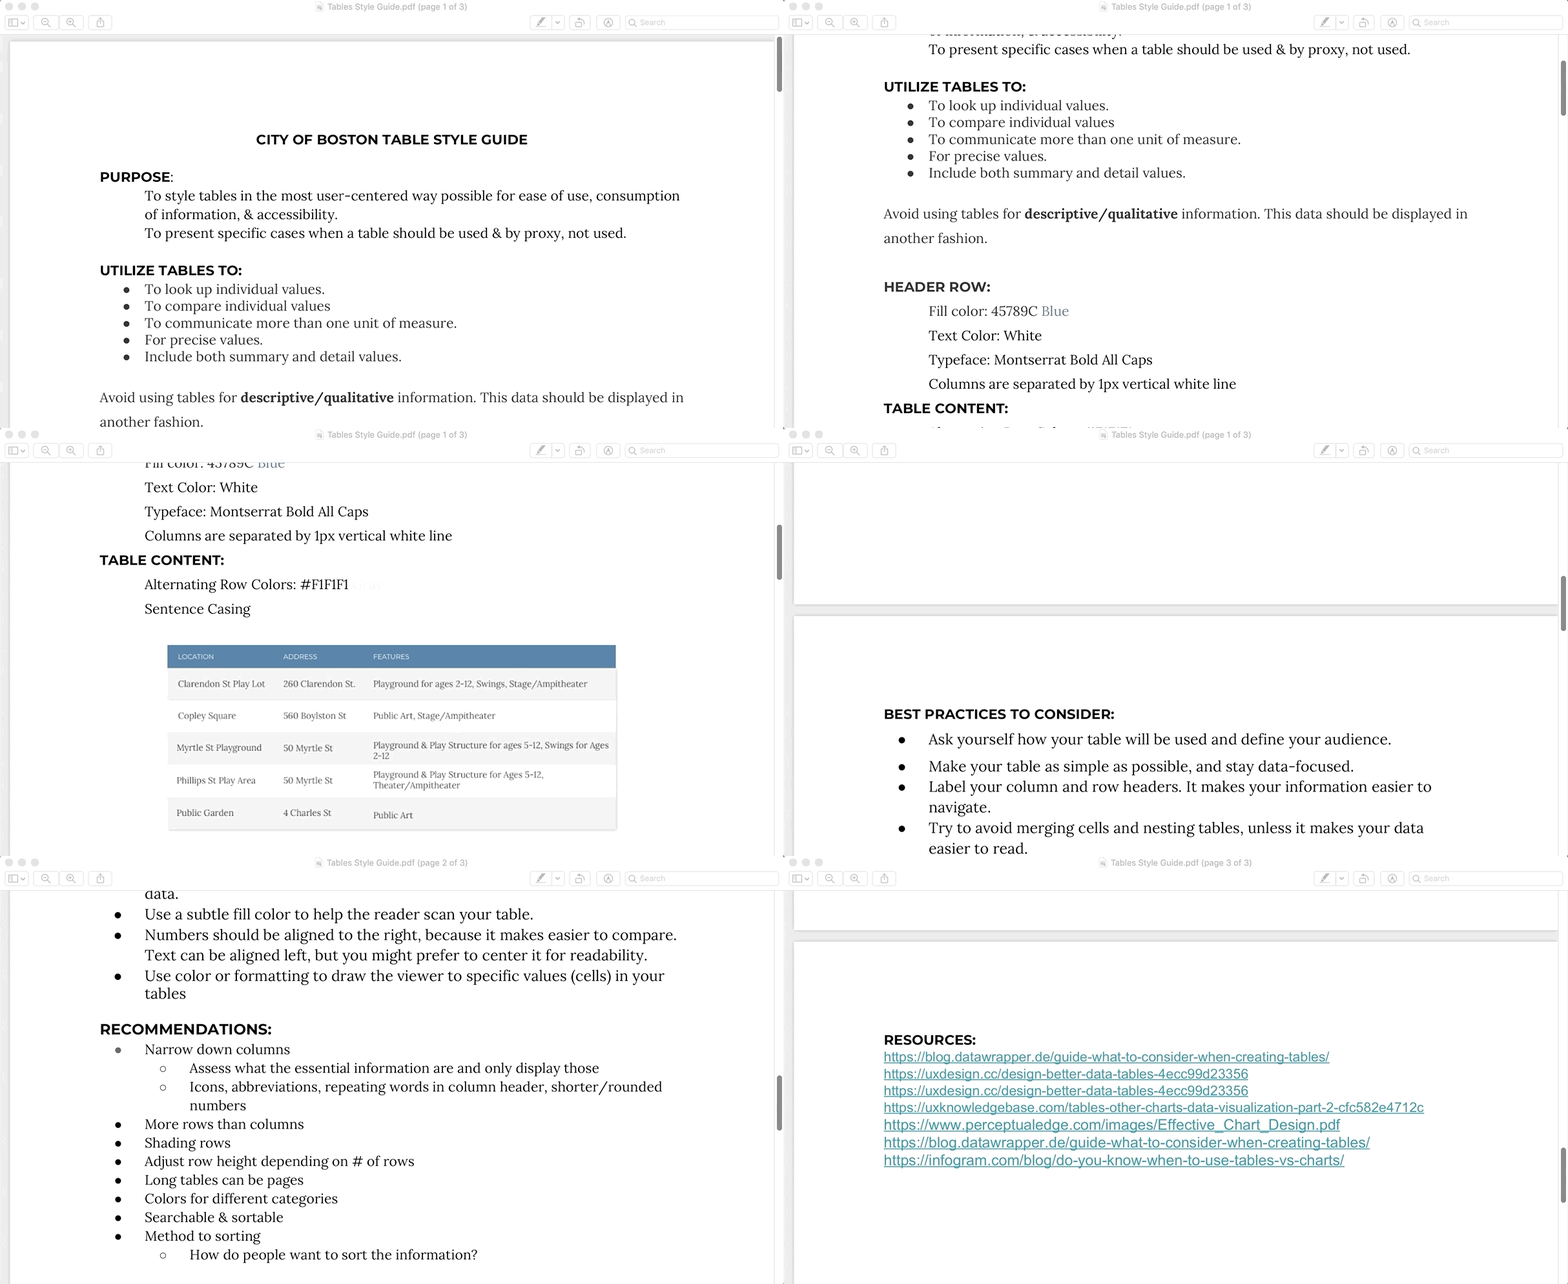
Style Guide for Tables
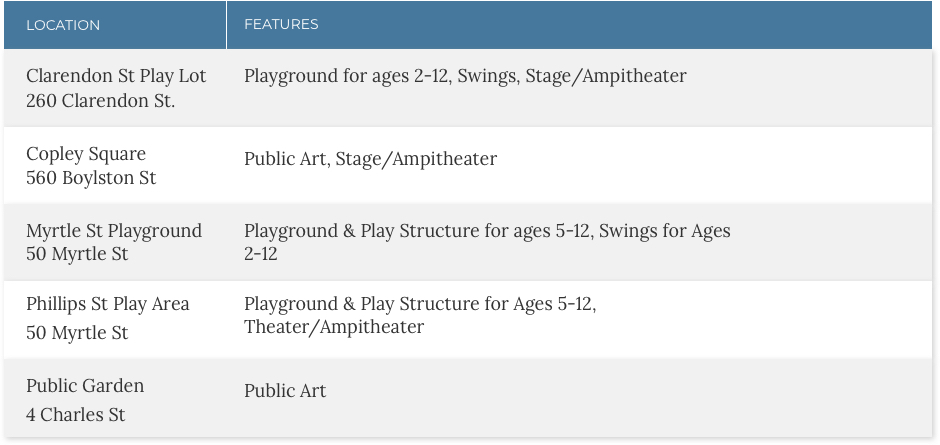
This is the redesign of tables that client was looking for. Not only did this land on a simple change through many iterations, this deliverable also included a document that outlined when & when not to tables, as well as what to keep in mind when using tables across boston.gov. This solution would be low amount of time/effort for a developer to implement.
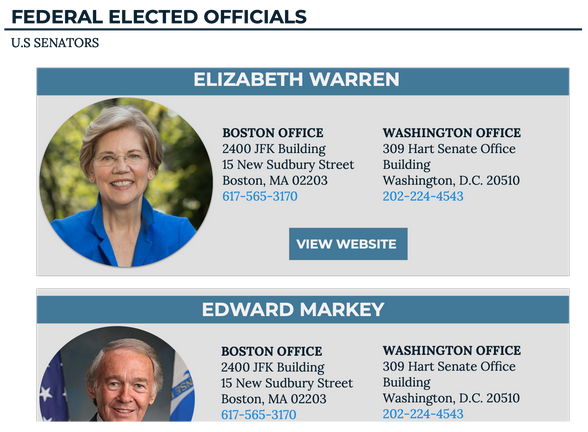
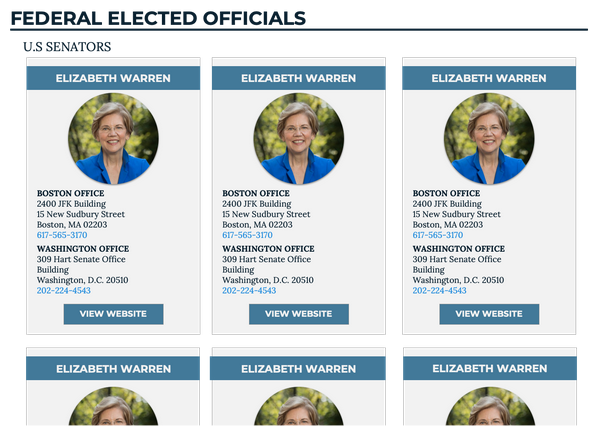
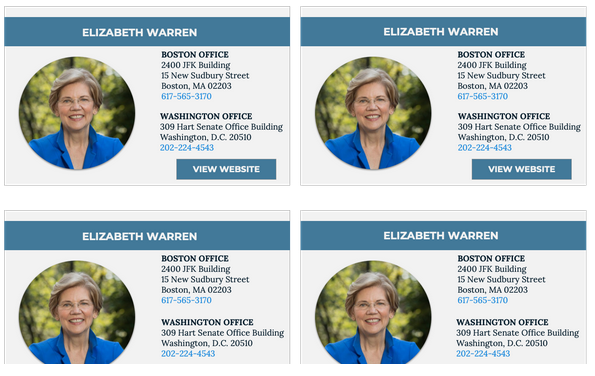
Elected Officials Redesign
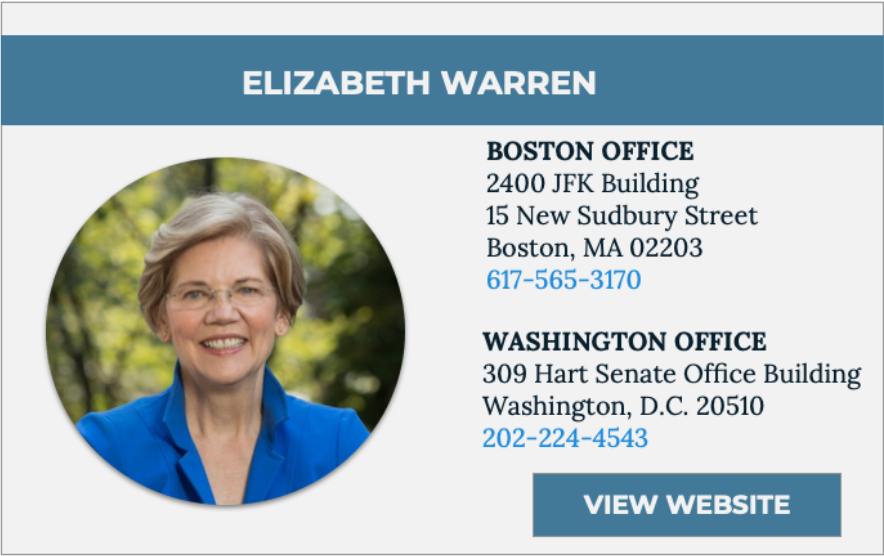
I recognized the need to redesign the "Elected Officials" through user research & audit of the use of tables on boston.gov. This template can be applied to all tables on boston.gov where people are currently represented in a table rather than visually. This solution would be medium amount of time/effort for a developer to implement.
Location Based Dataset Redesign
The complete redesign for visualizing location-based datasets is the culmination of all our research. While this would take the highest amount of time/effort from a development stand point, all of our user research led us to this solution. We utilized techniques as progressive disclosure to reduce cognitive load, side-by-side interaction between the map/list, & the City of Boston's design system.
"Oh, you want to see the details?
Great! Details are my favorite!"
Defining Scope
First Client Conversations
I led our team in a discussion with the client around the following key points:
- Why did they choose to use tables to begin with?
- How do they see improvements to the usability of tables?
- What if users do not really want this information visualized?
The City of Boston engaged with these questions & were very interested in finding answers with these questions, however they were very clear that they were most interested in a "style guide for tables." We learned from this that we have an opportunity in this project to express user's needs while balancing the client's project goals. After further discussions, we decided to focus on location-based datasets & how they are communicated on boston.gov. More details about this conversation & definition of scope can be found below.
Initial Scope
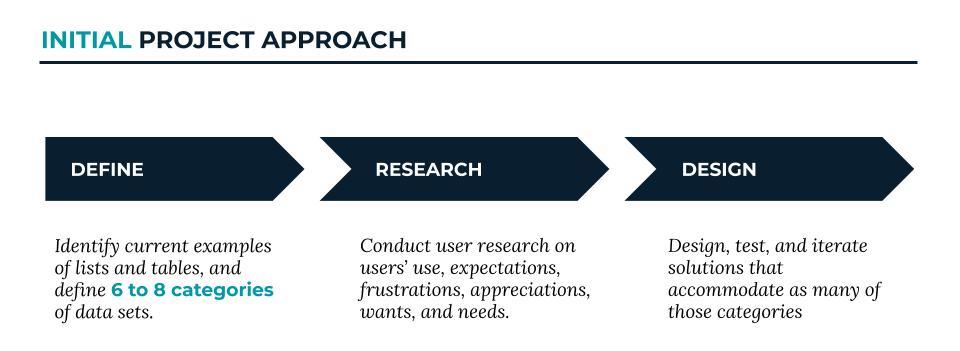
The City of Boston gave us an initially very vague topic. On the surface it seems straight forward- figure out when & when not to use a table, what it should look like, & show it in action on boston.gov.
The vagueness set in when we realized there are over 300 datasets on boston.gov. This made us laser focused on defining a scope that would provide the highest impact within 3 weeks.”
This idea came from the Usability Testing Concept that you only need 5 testers to account for 85% of the problems with a system. We posited that by defining 5-8 categories from 100 datasets (out of 300), then create 3-4 designs to account for these categories, this would account for most if not all of the different types of datasets.
Refined Scope
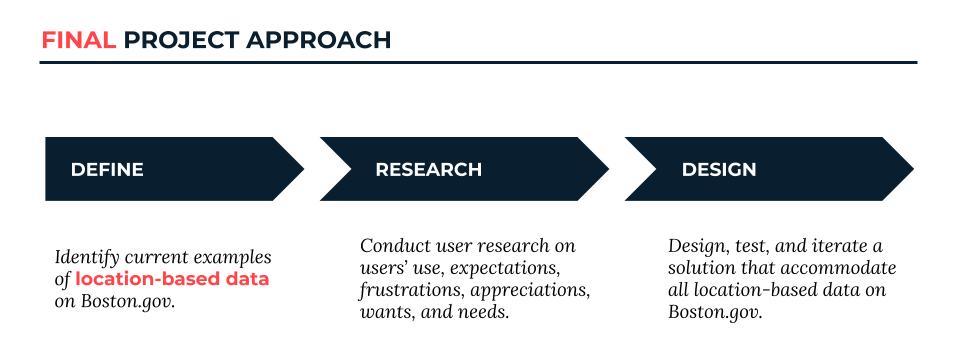
The City of Boston was very supportive of our initial approach to this problem. However, they shared the same apprehension as us- that the initial approach is most likely a broader project than 3 weeks. They suggested focusing on one of the categories: Location Based Data Sets. However, they did remind us that they are primarily interested in a “style guide for tables."
Research Process
Current State
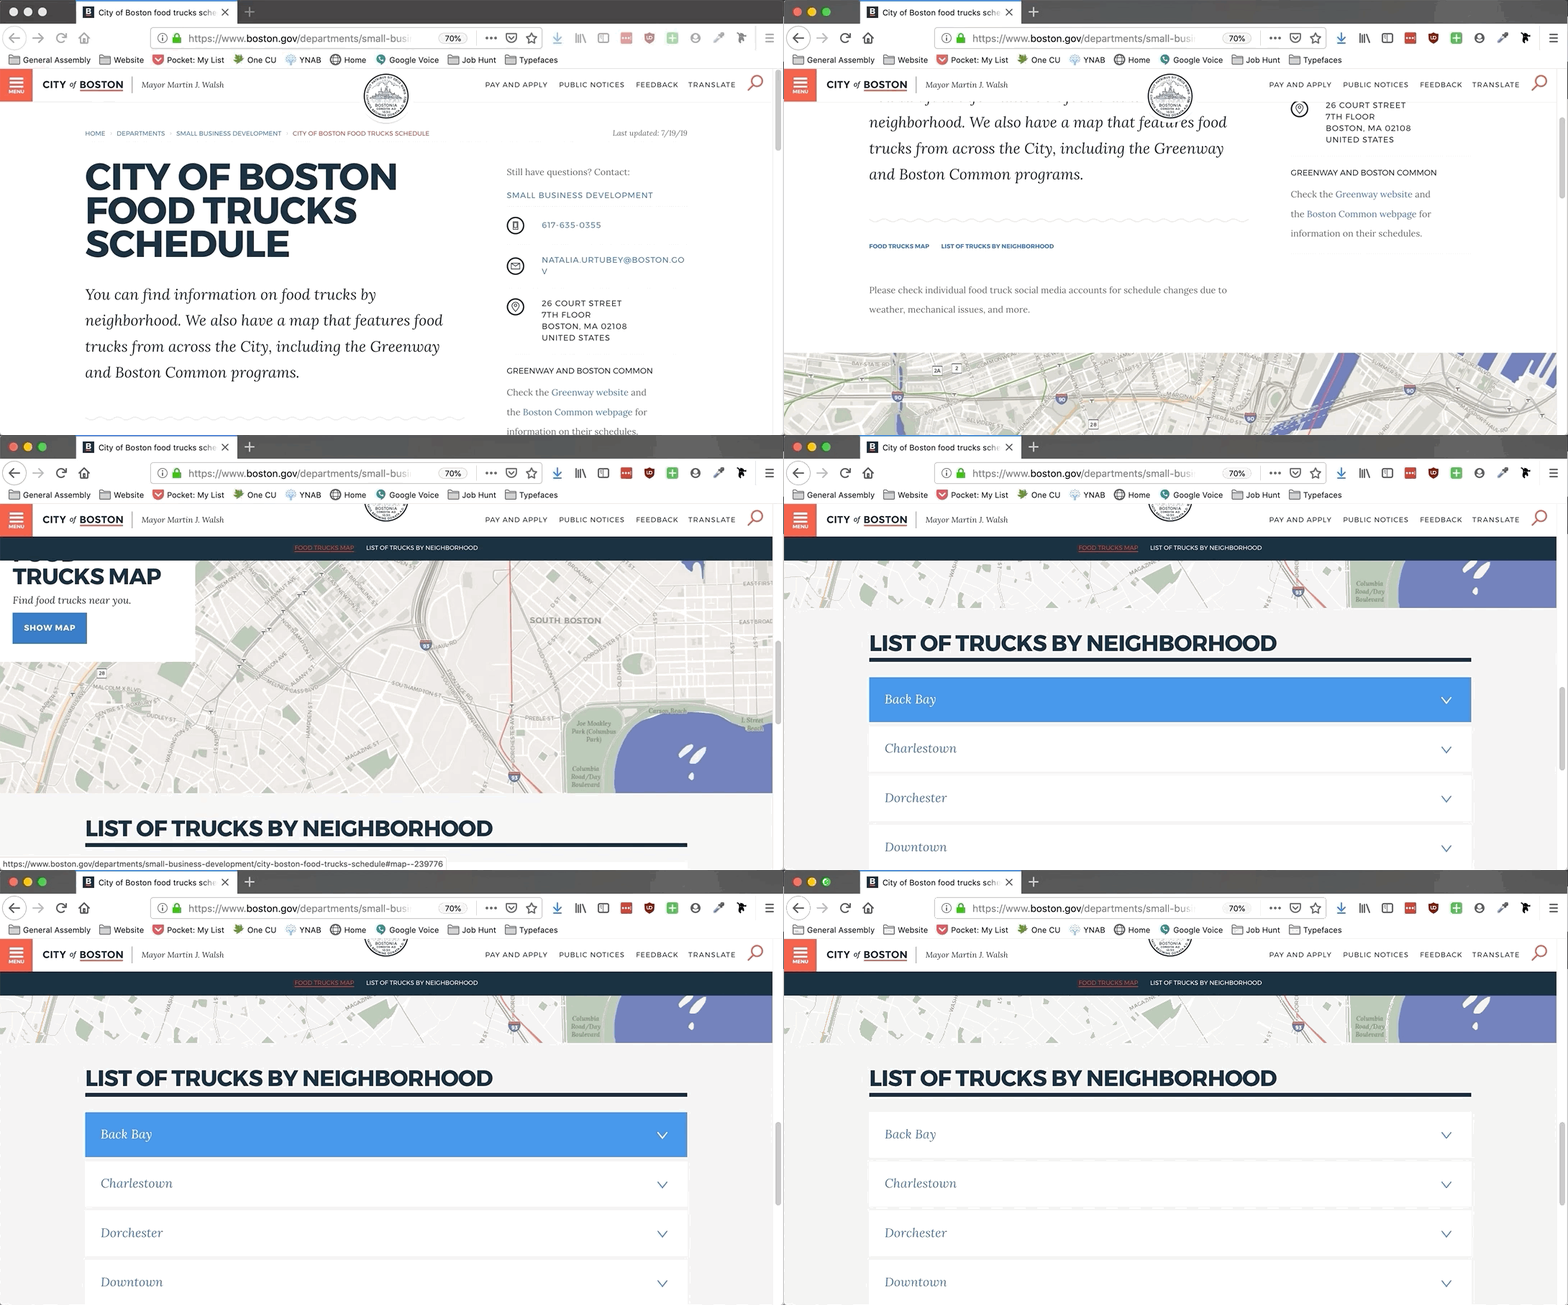
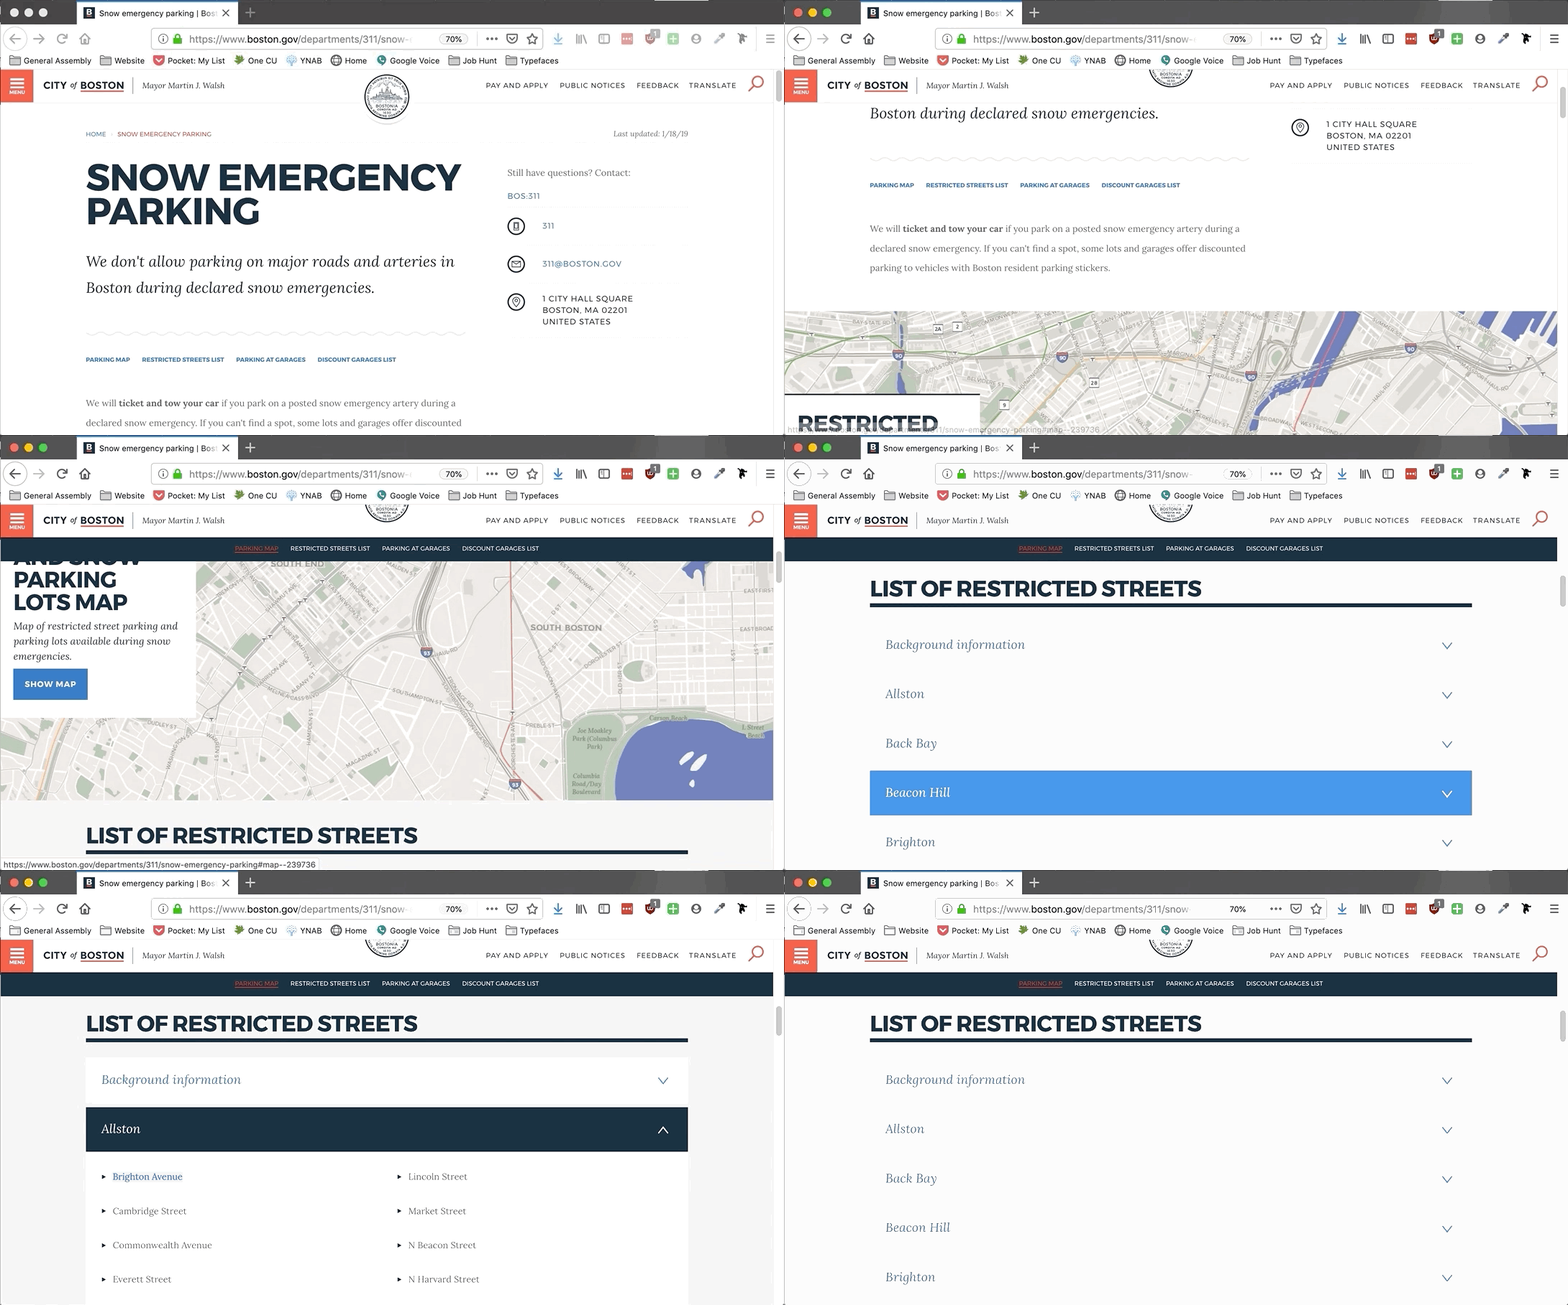
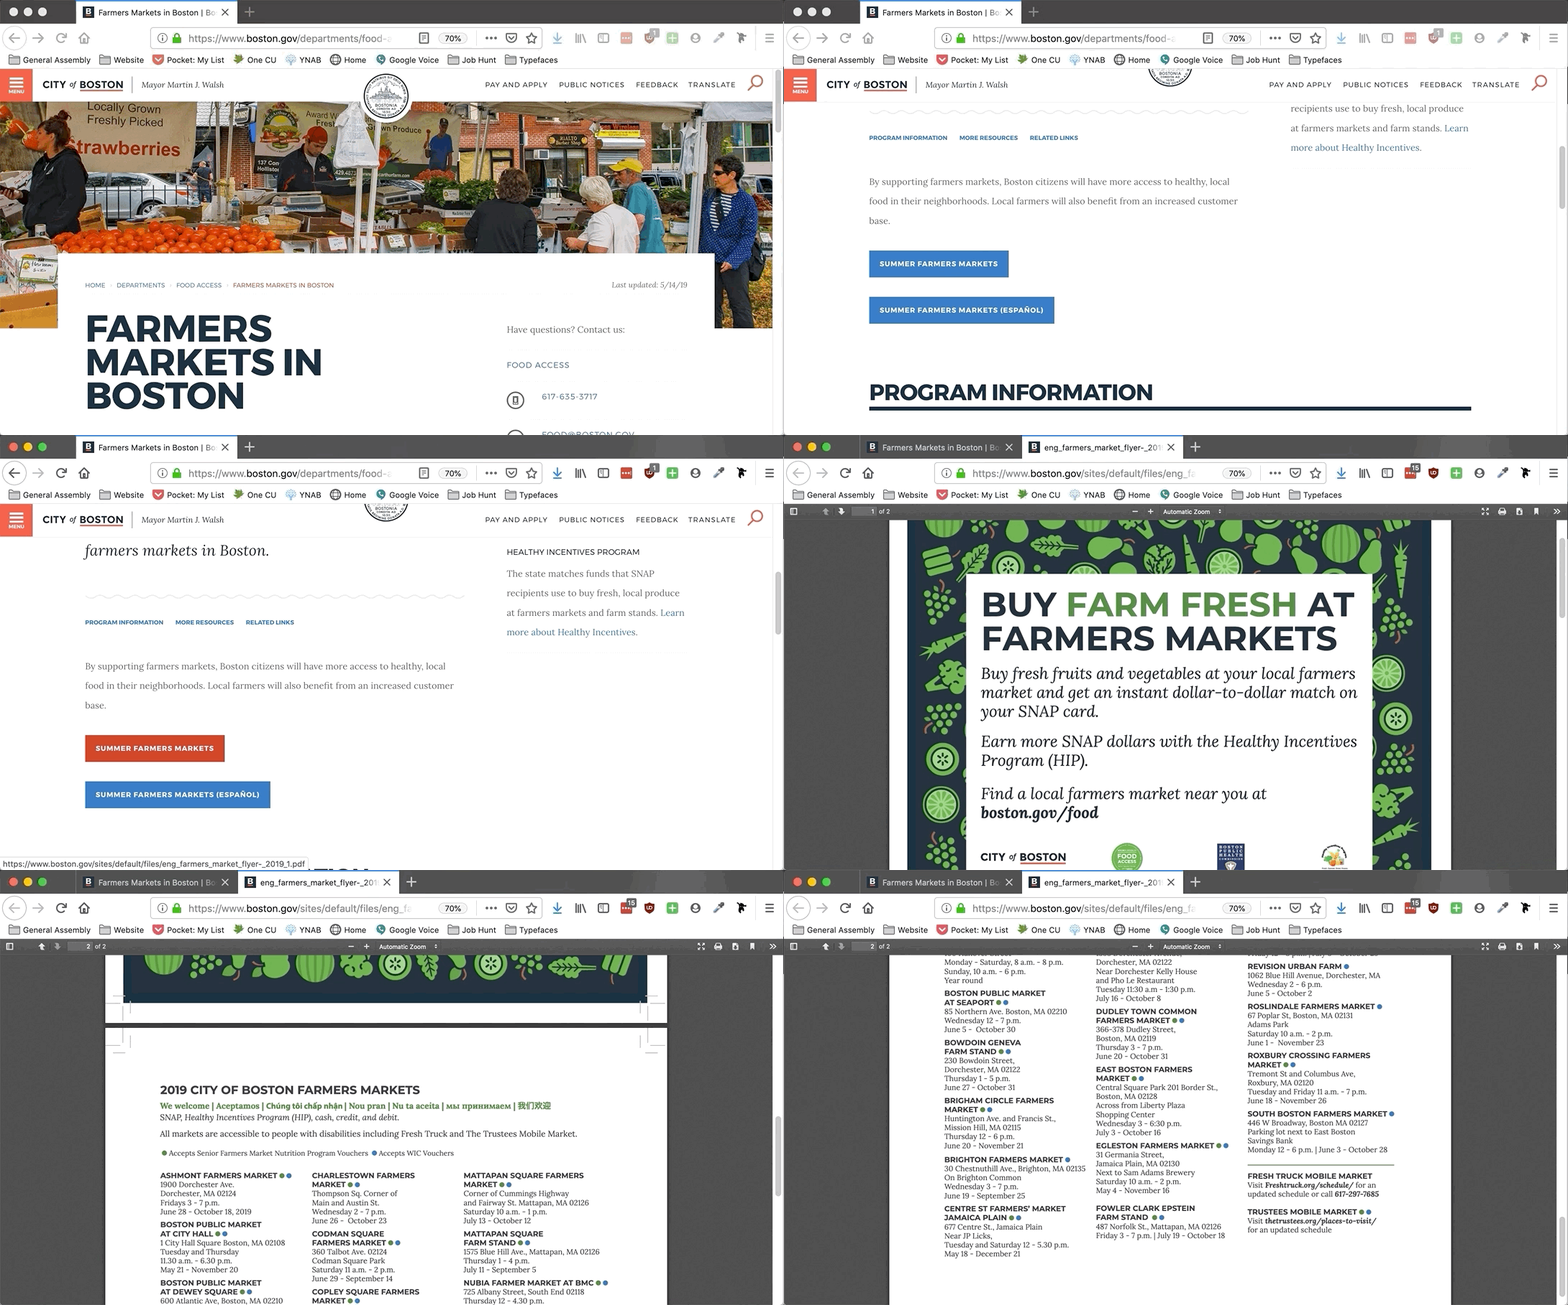
Utilizing Google Analytics, we identified the 3 most visited location-based datasets. It became immediately apparent that these pages have 3 different designs to display the information. Also, while responsive, the design did not translate well to mobile.
Food Trucks
Tables within dropdowns by neighborhoods.
Snow Emergency Parking
Lists within dropdowns by neighborhoods.
Farmer's Markets
Sends user to a 2 Page PDF with Small Print- very inaccessible.
Comparative Analysis
Learning what users expect from location based experiences on mobile & desktop.
Use of Product Cards

Progressive Disclosure

Product Card/Map Interaction

Measuring a Control
Quantitative
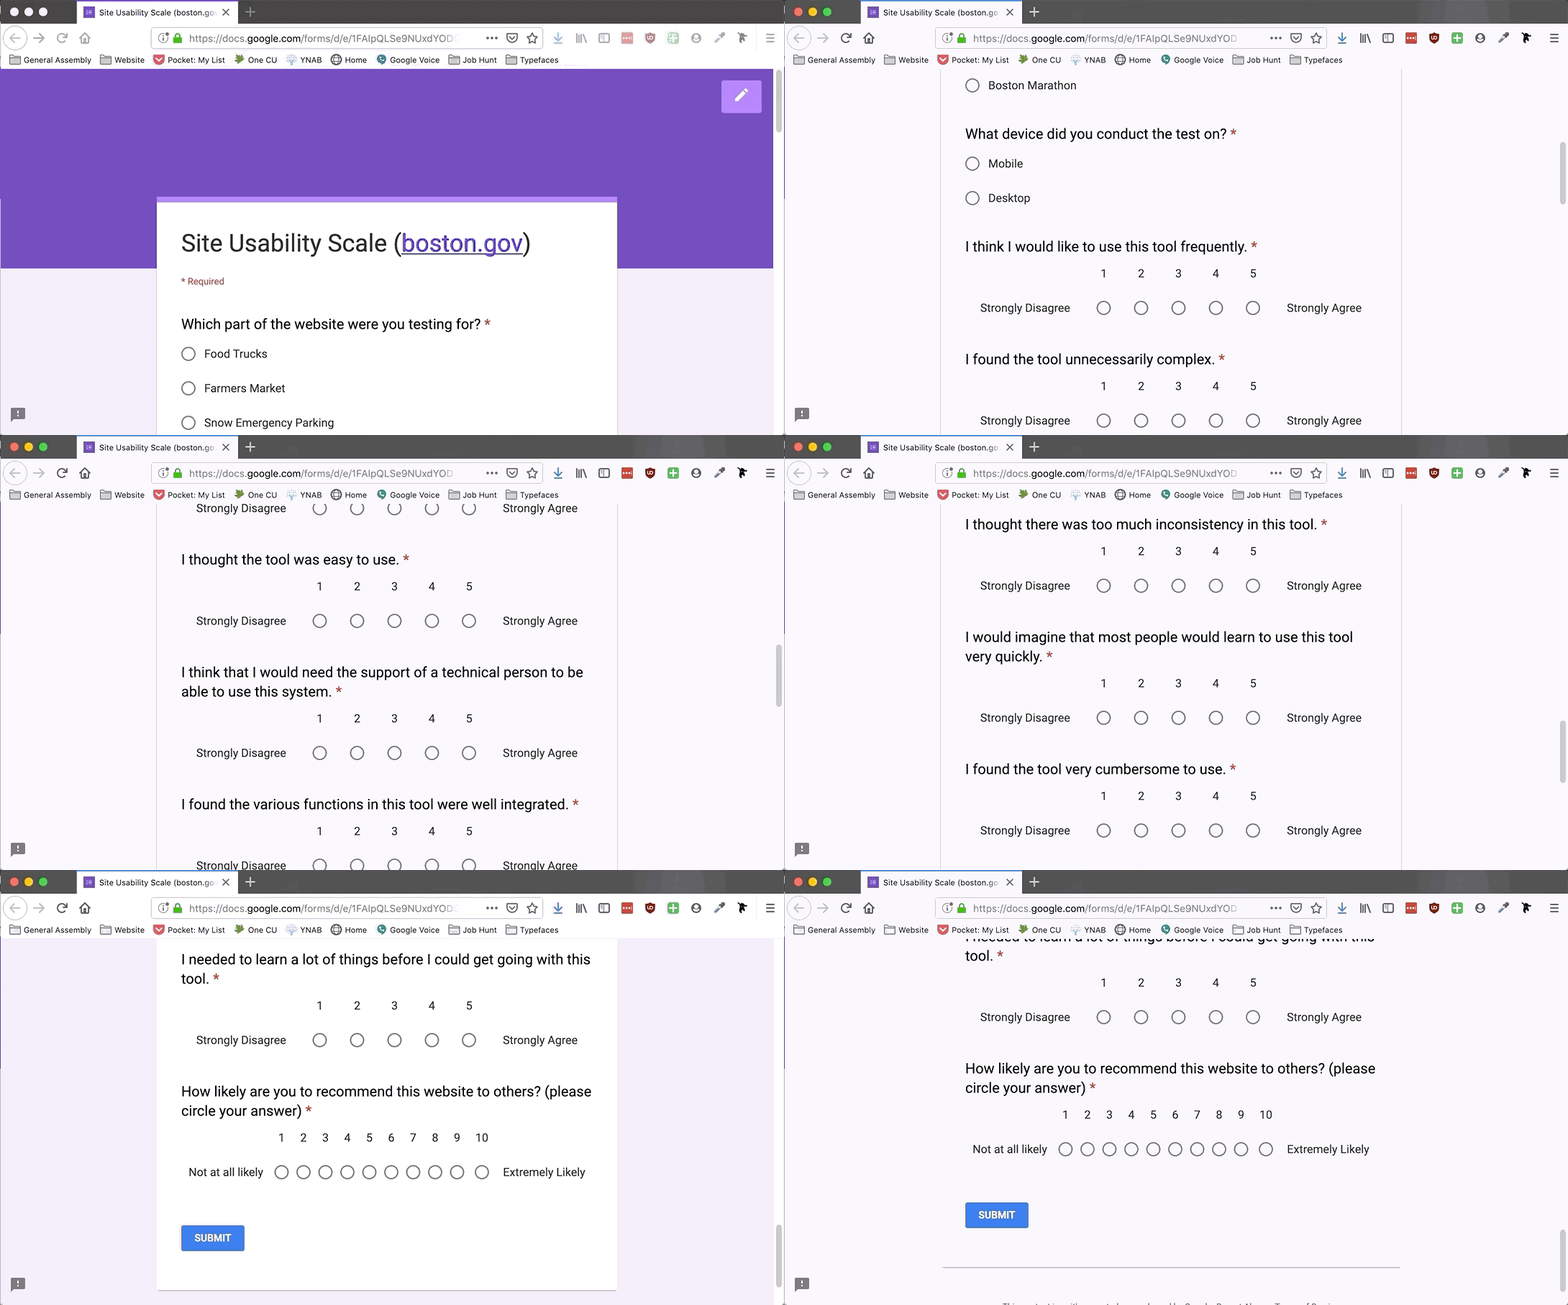
We employed a Site Usability Survey (from usability.gov) to quantify the current usability of mobile & desktop versions of each location based dataset site. This survey was administered after a usability test.
Qualitative
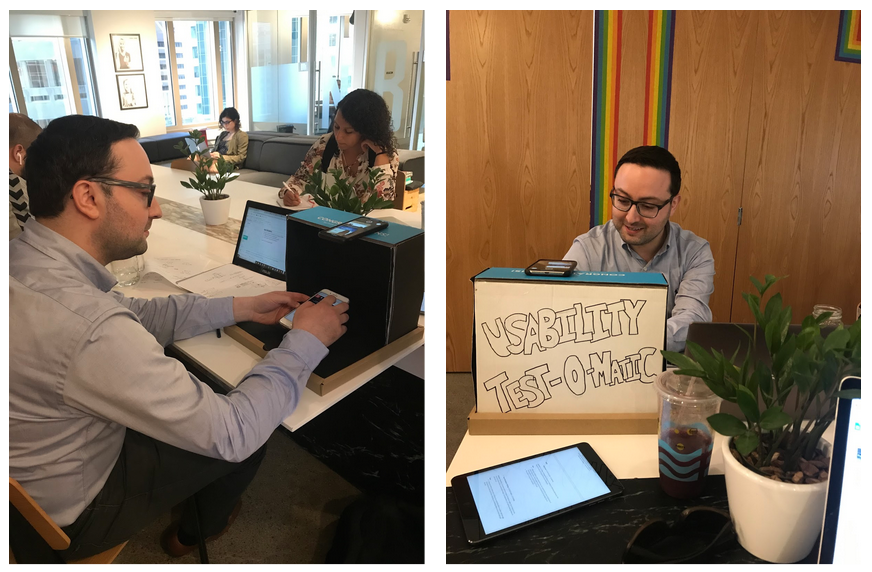
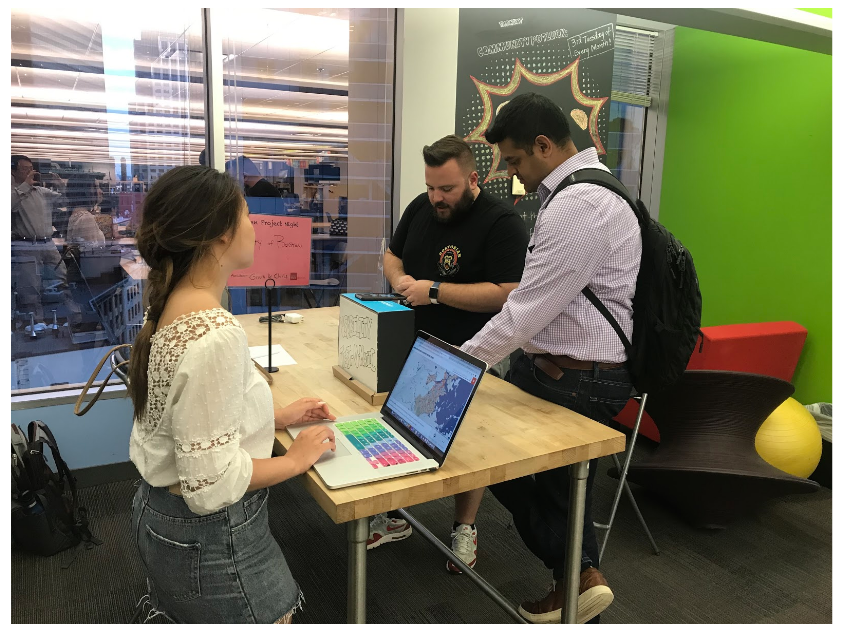
We needed a way to record/capture our users using each site, while we conducted contextual inquiry. On desktop we simply recorded the screen & audio. However for mobile, this would not work because we wanted to be able to see them interacting with the phone, & record any errors; a screen recording would not suffice.
In lieu of installing a tool like Hotjar, we devised a simple way of recording these sessions. We called it the “Usability Test-O-Matic.” While very simple (made out of cardboard) it was very effective at recording the sessions as well as attract interest from users during guerrilla testing.
Other Research Methods
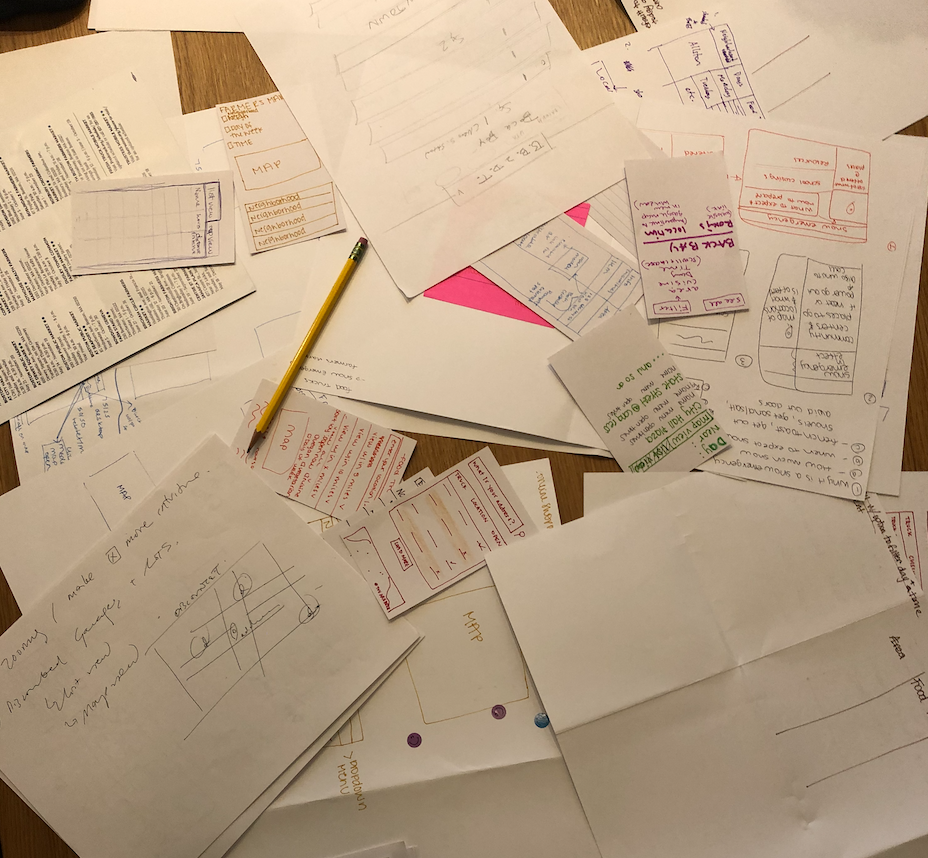
Participatory Design
We had each user draw how they would have expected the data to be displayed. We also asked them to show how they’d expect to see the data in the table.
We used this to identify trends across people’s expectations in both formats & helped visually see what was voted on the most.
User Interviews
We interviewed users to understand:
- The context they go searching for this information
- How they expected this information to be displayed
- Other tools they use to get this information
Putting This All Into Action
We went to networking events as well as employed “guerrilla/street” testing methods to reach our users. Because of this, we streamlined all of the methods into a quick 15 minute session so that we could increase the volume of participants.
Design Workshop
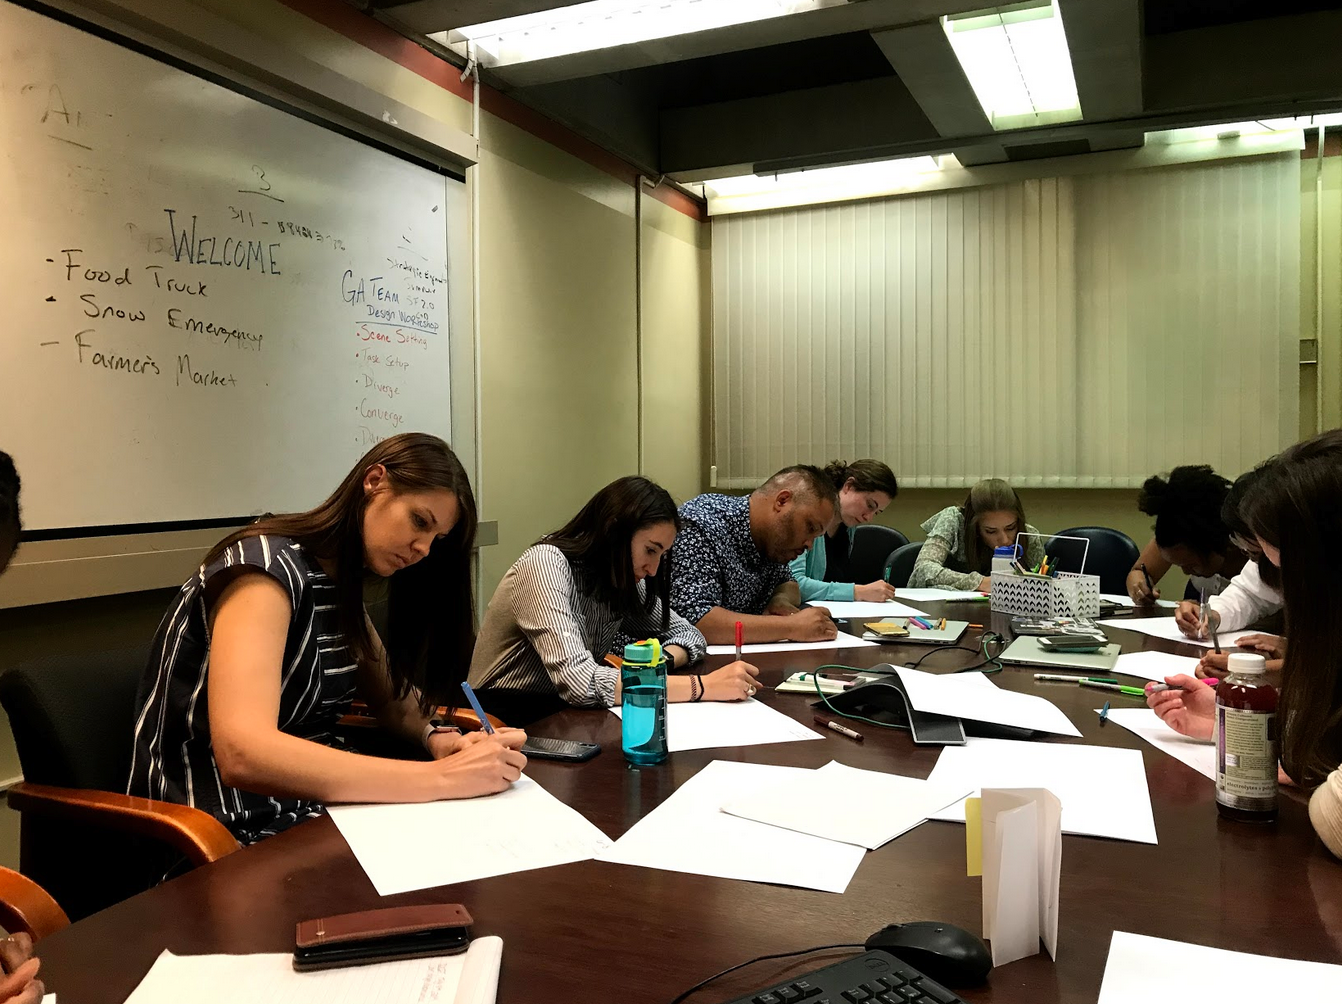
After all of our user interviews we decided to run a design workshop with the DoIT team from the City of Boston. We also recommended they invite stakeholders from outside of their team as a way to bring them into the design process & help strengthen their relationships with external teams.
5 minutes to sketch as many ways to visualize one of the location based datasets (most people chose food trucks).
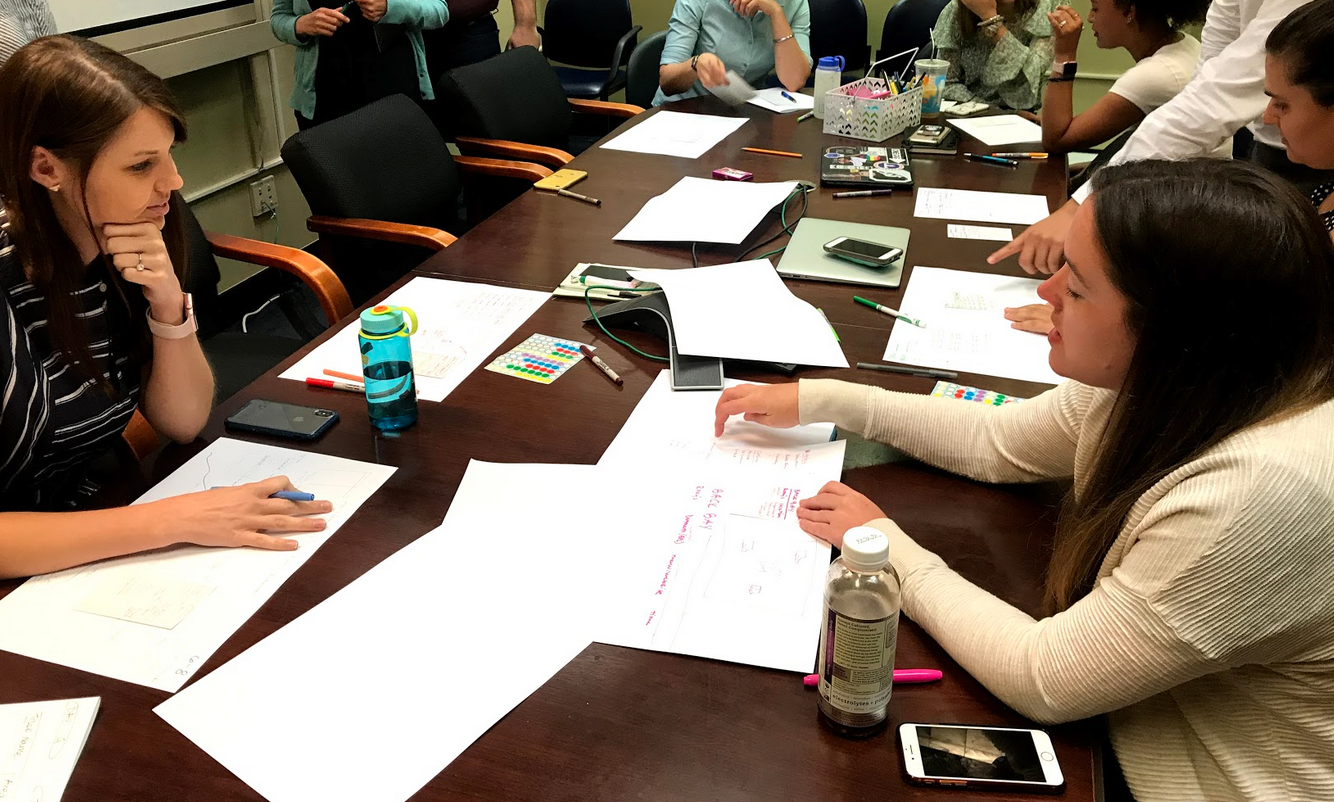
Pitching their ideas to the group. This took much longer than expected, but proved to be very fruitful in terms of research. We heard comparisons made to other sites such as e-commerce/real estate listings, as well as how they want the information to relate to their location.
Another 5 minutes sketch occurred after the group discussion. Based on the feedback & ideas from their peers, the group was tasked with creating one design they would like to see on boston.gov.
At the end of this 5 minutes, we tasked them with converting that design onto a mobile device by having them draw on a note card.
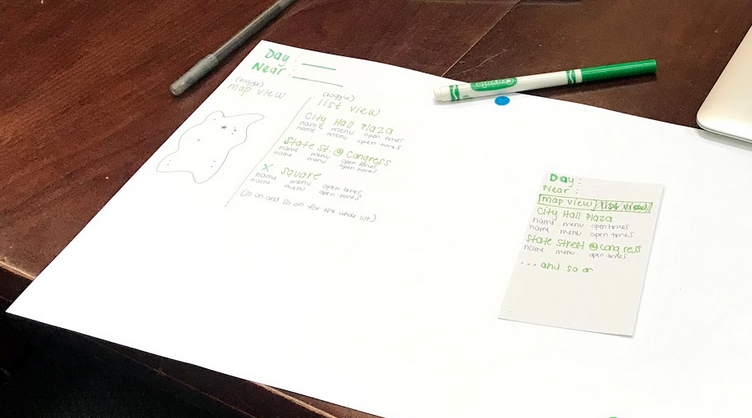
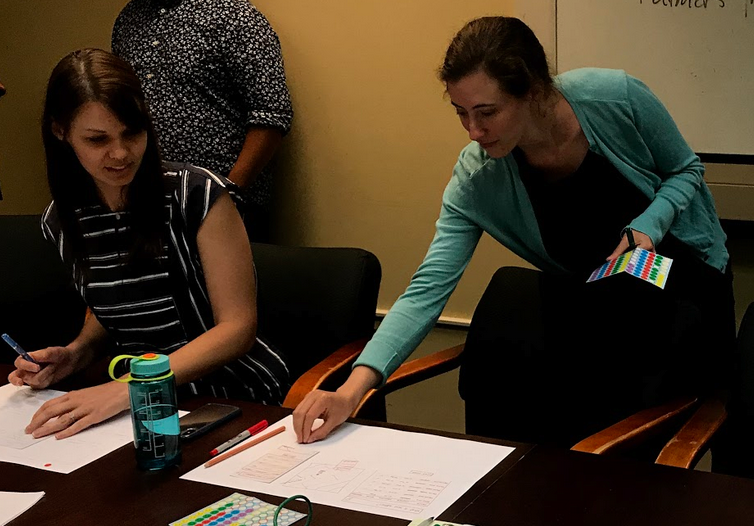
Dot Voting was used to determine the best designs from the group.
Due to the length of the first group discussion, we ended the workshop by giving everyone the chance to walk around with stickers & pitch their final designs to each other.
These stickers also helped us determine the leading designs during synthesis.
Academic Research
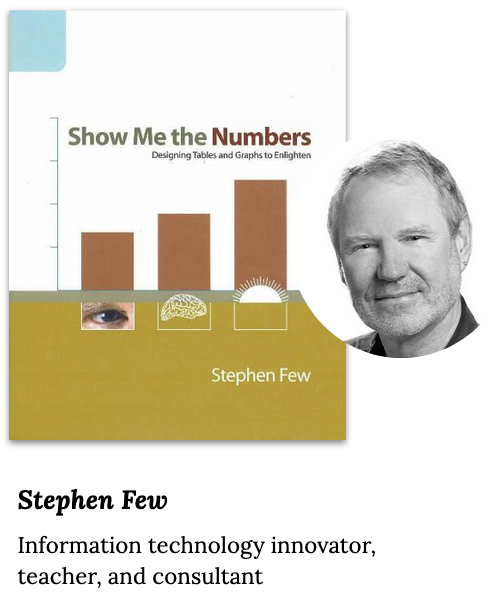
To round out our research phase, we wanted to know what the expert guidance is on when to use a table & how a table should look. This research led us to the work by data visulization expert, Stephen Few.
Stephen Few reccomends using tables to:
- Look up individual values
- Compare individual values
- Communicate more than one unit of measure.
- Display precise values.
- Include both summary & detail values.
Research Synthesis
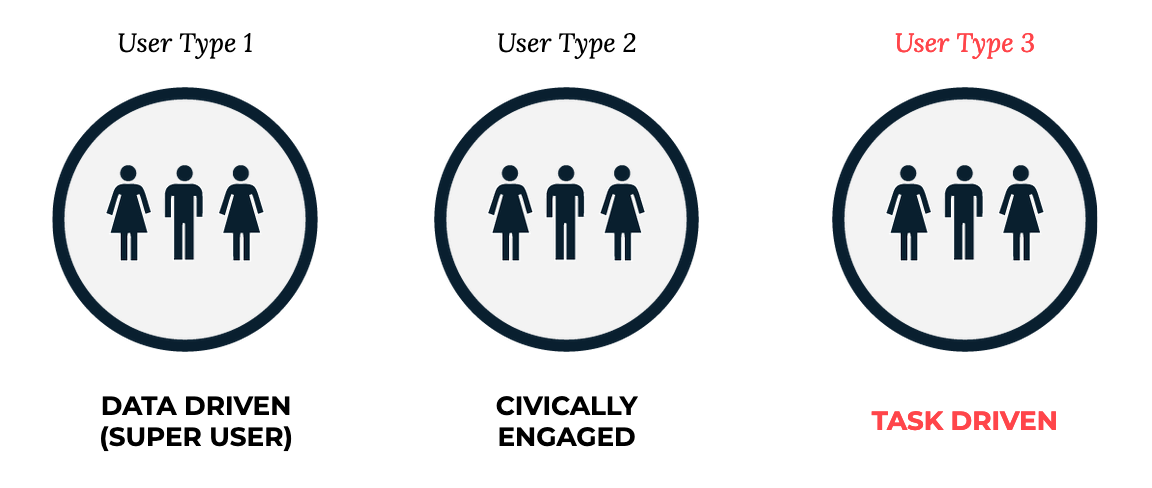
3 Proto-Personas from the City of Boston
Our work focused on the "Task Driven" user.
We learned from our research that this user expect:
- Interaction between a map & a list/table.
- Information to be sorted by distance from their location.
- If a table is used, the columns are limited & they can sort/filter the data.
Control SUS Score
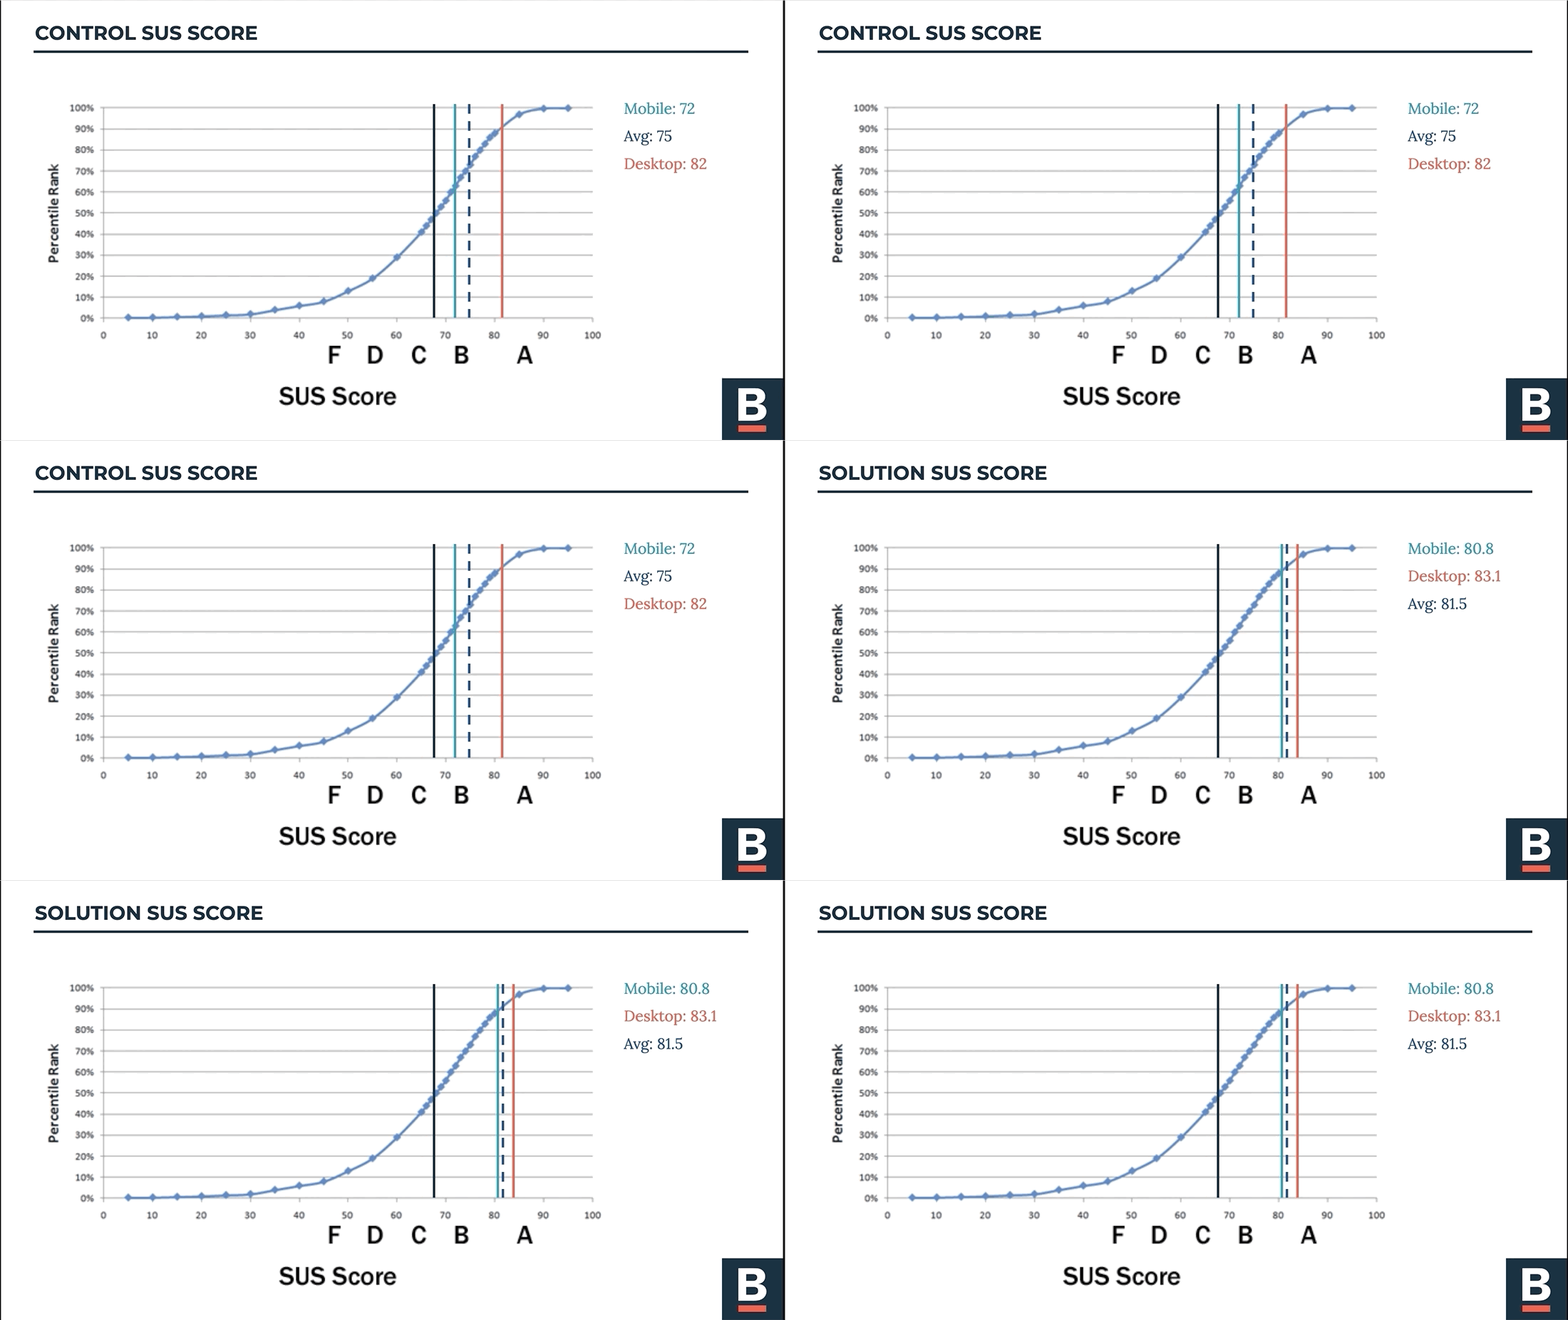
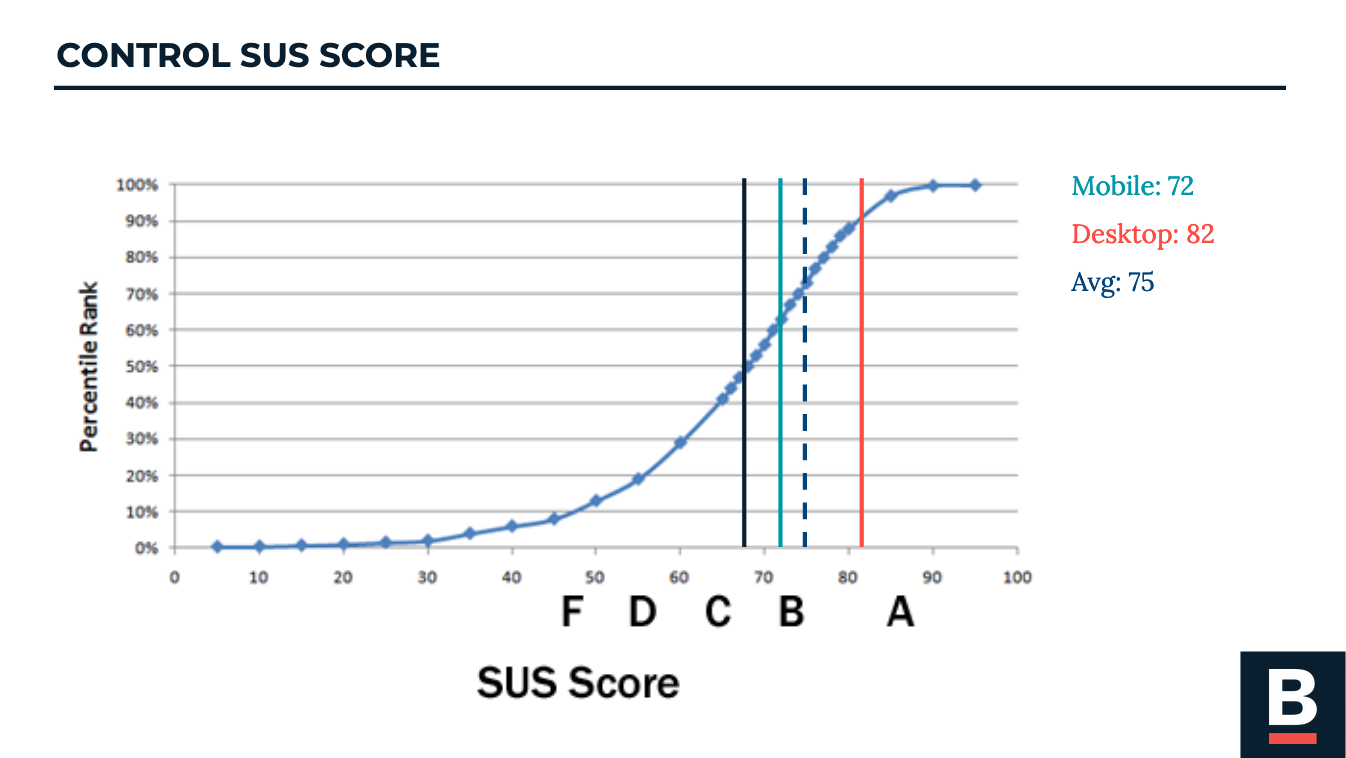
This picture displays the results of the site usability survey we used as our control. A score over 68 is considered "above average usability." Seeing our control score at an average of 75 was impressive.
This was truly an “aha!” Moment for us as a team. This entire time we were looking for a glaring problem to solve on boston.gov. This finding reframed our thinking towards offering a refinement/improvement instead of a solution to a problem.
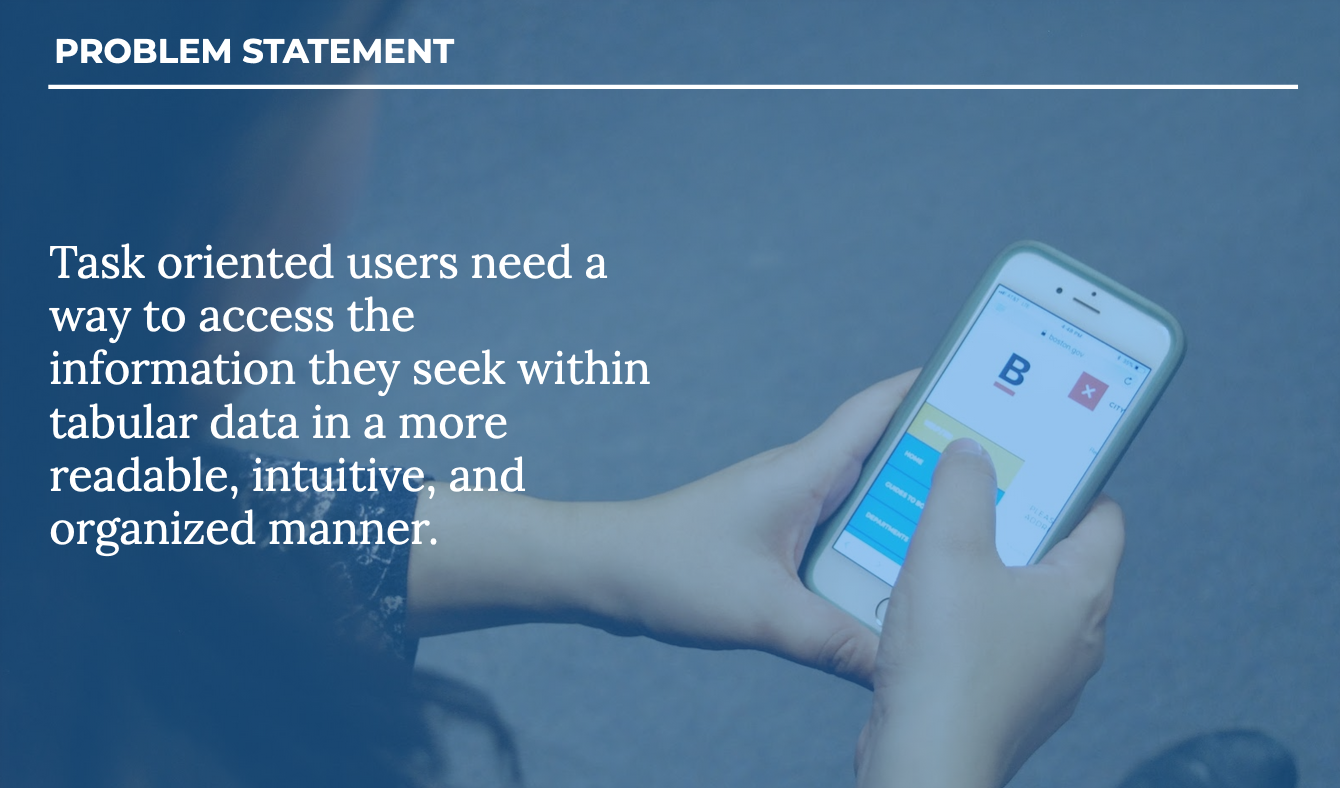
Problem Statement
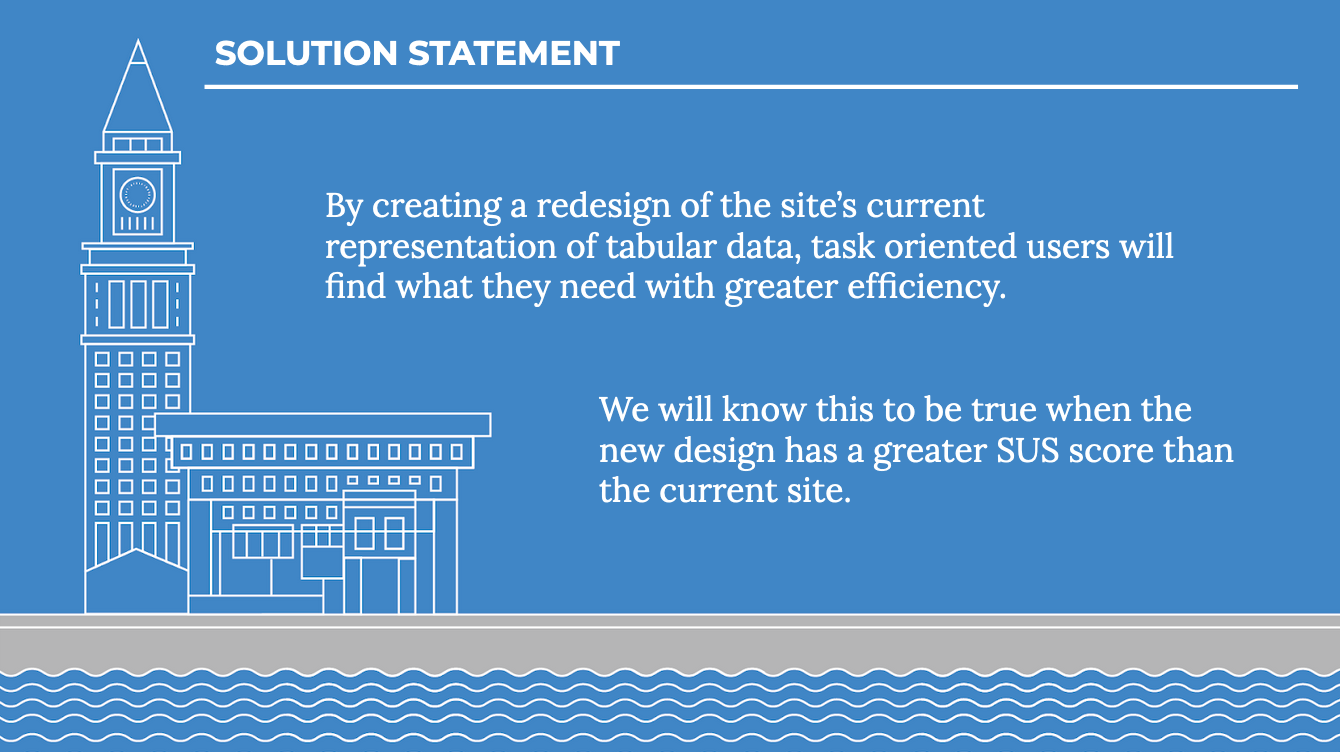
Solution Statement & Hypothesis
Design Process
Research Takeaways & Design Plans
Research revealed that what our clients are looking for & what users would like to see, are 2 different ways to improve the boston.gov
We decided to frame our solutions on a “better-best-great” spectrum.
We would accomplish this by delivering:
- An improved tables style guide & recommendations on when to use them. This will offer what the client is looking for & allow for immediate improvement at relatively low cost of implementation.
- Upon deeper research on boston.gov we recognized we could deliver a solution for the elected officials page. This solution would be a medium cost of implementation, with immediate improvement.
- A solution for what to use when we recommend not using tables. While this solution should provide the greatest impact for improvement, it will also come with a higher lift from a developer/implementation perspective.
Improving Tables
Multiple iterations of tables working with:
- Adding/removing gridlines
- Gridline weights
- Casing of Text
- Different Colors (from brand guidelines) for headers
- Collapsing information to decrease number of columns
Letting the User's Choose
- We decided to run a small scale A/B/C test by asking users to choose which table they preferred & why from page 1.
- We then asked them the same question for page 2.
- Finally, we asked them to choose between the winner from pages 1 & 2.
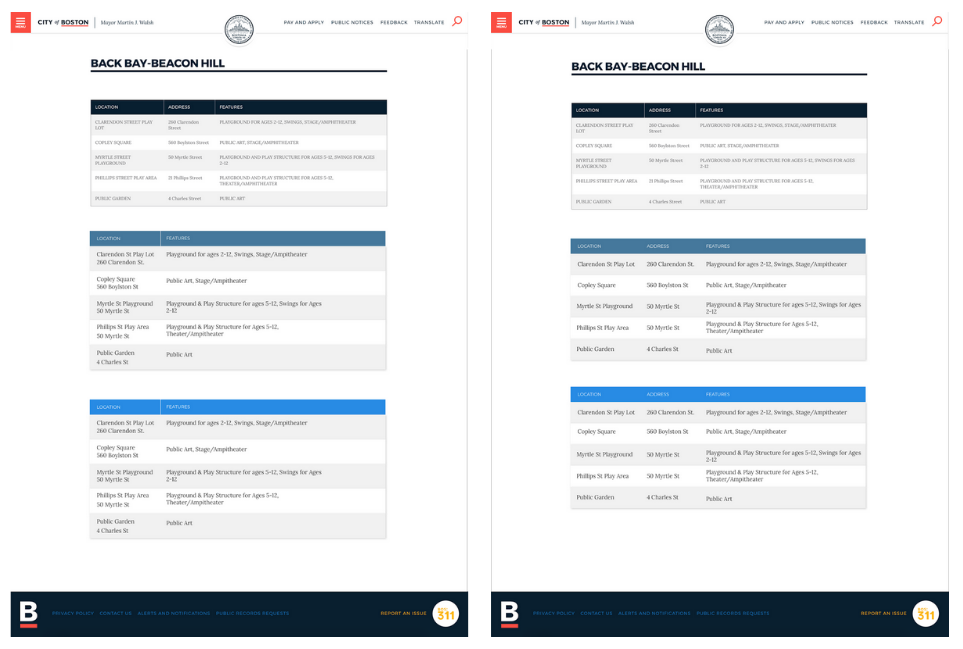
The Clear Winner
Users described this table as being more “accessible,” “approachable,” & “readable.”
Style Guide for Tables
We then completed our style guide that includes all of our recommendations for tables from our research. This covers everything from styling, to when/when not to use tables.
Improving the Elected Officials Page
We followed a similar workflow for the elected officials page.
Here are a few versions we created for another A/B/C Test:
The Clear Winner
Here are a few User Pull Quotes:
- “You get more info per screen without scrolling too far.”
- “I like to see visuals & faces.”
- “The ‘view website’ is a button instead of a line so it’s harder to miss.”
- “Able to see more at once, but not too crowded”
Improving Location Based Dataset Sites
We then excuted the redesign of location-based data visualization that users were really asking for.
Our responsive design was made for Food Trucks, Snow Emergency Parking, & Farmer's Market, but could also work for any other location-based dataset on boston.gov. We applied this design to all 3 sites from our control & ran the same tests, including the Site Usability Survey to compare our design to our control.
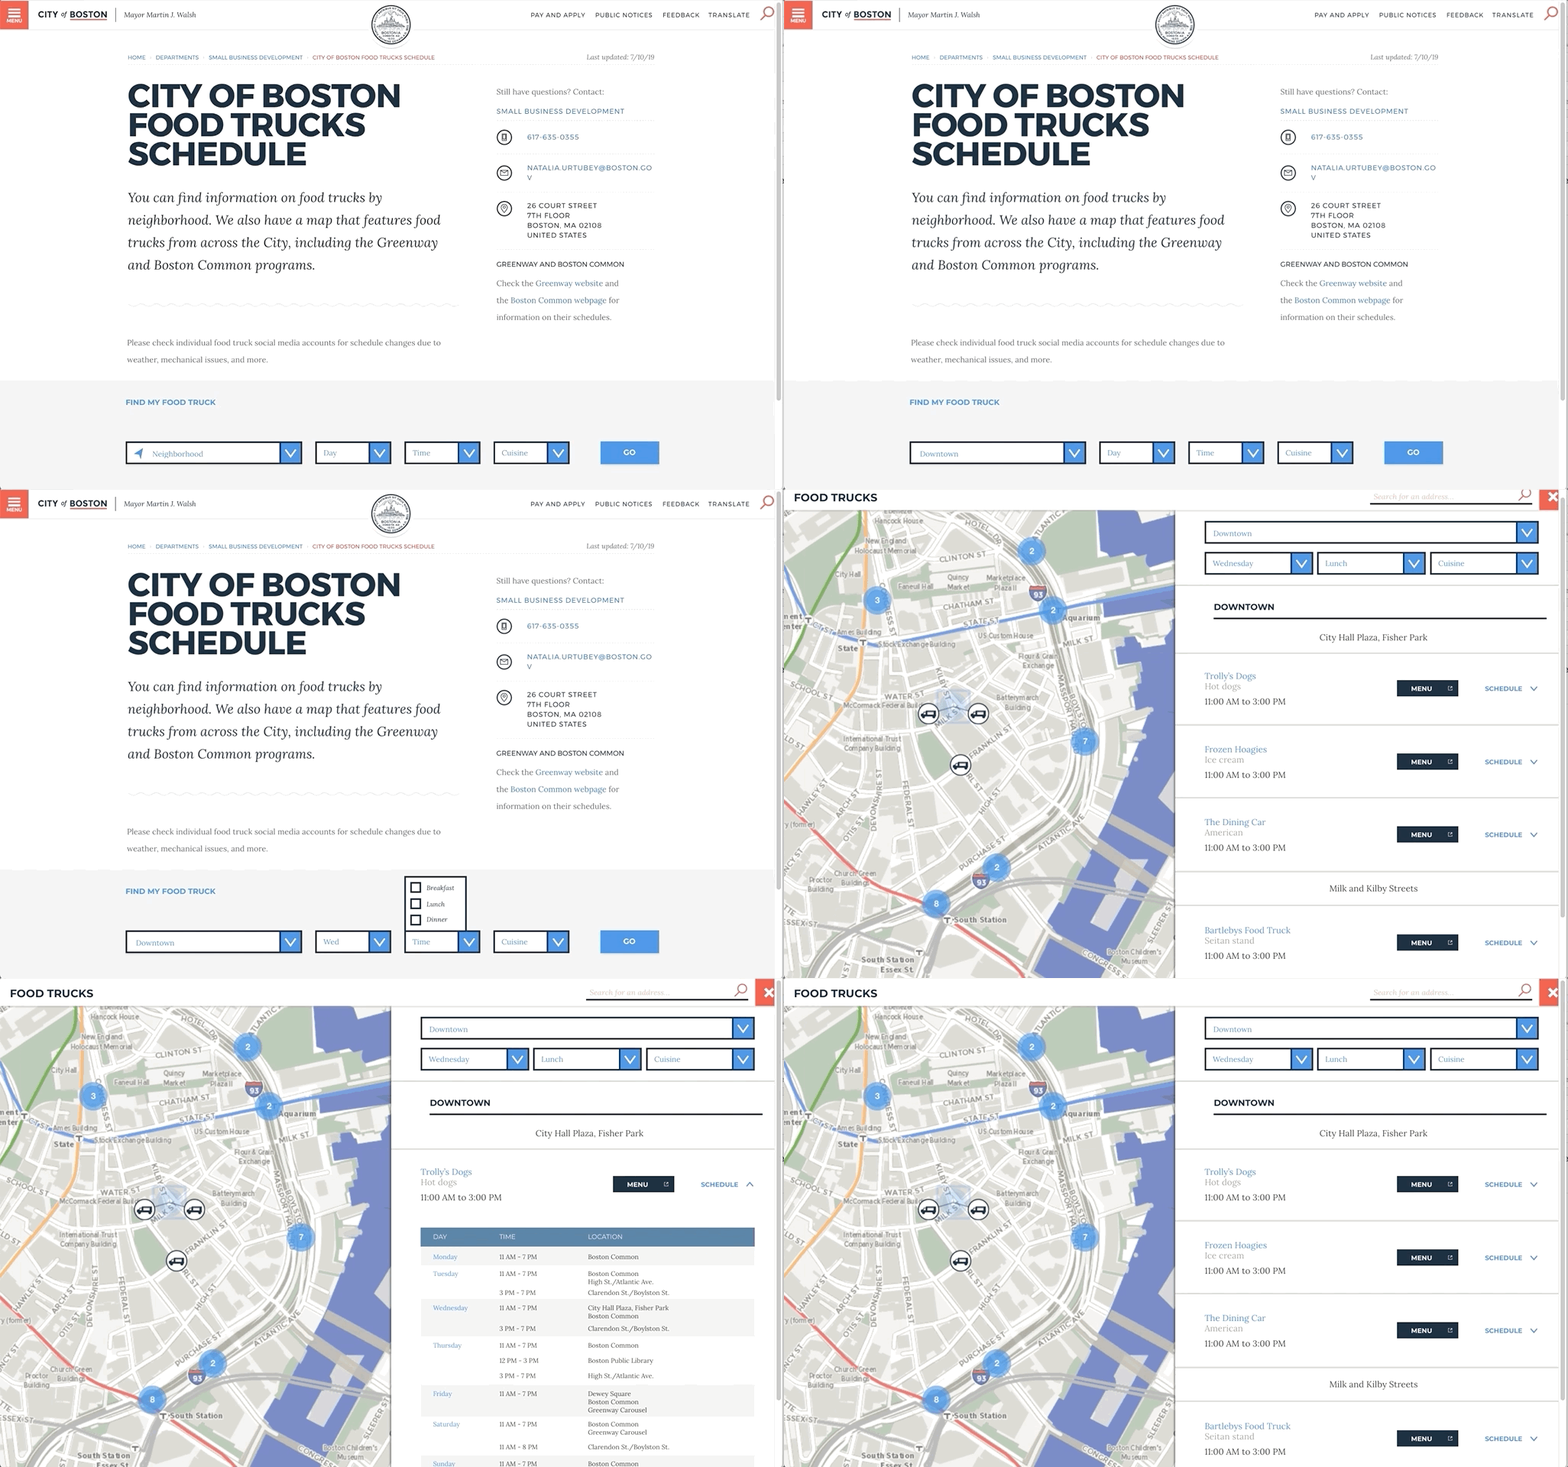
Here is the design applied to the Food Truck site:
Results
Site Usability Survey
I took our designs & ran the same usability tests from before with new users.
We then had users take the same Site Usability Survey.
The new design earned a 6.5% increase in site usability. Any increase greater than 5% is considered a considerable improvement.
It is also important to note, it becomes more difficult to improve usability as the score increases.
The new design narrowed the gap in usability between dekstop & mobile from 10% to 3% usability.
An average Site Usability score over 80.3% puts this design in the top 10% of site usability on the web.